New report JOLTS claim that extended benefits breed unemployment

Greg Hannsgen | September 8, 2010

US Private Sector Hires Layoffs Discharges and Quits Seasonally Adjusted

Last week, my colleague Tom Masterson commented on an op-ed piece by Robert Barro, which argued that much of the U.S. unemployment problem―perhaps 2.7 percentage points of the June unemployment rate of 9.5 percent―could be attributed to the availability of extended unemployment insurance benefits.

According to Barro’s argument, huge numbers of people are out of work by their own choice. In fact, data released yesterday from the Job Openings and Labor Turnover Survey (JOLTS) suggest that something very different is going on. Some economic theories about unemployment are based on the notion that workers use more of their time for leisure activities or full-time job search at times when their wages or salaries are relatively low. An example would be an  ice-cream vendor who takes time off on cool or rainy days because sales are expected to be weak at such times. Along these lines, Barro has recently argued that Congressional extensions of benefit eligibility have made paid work less desirable for recipients whose checks might have been discontinued in the absence of new legislation.

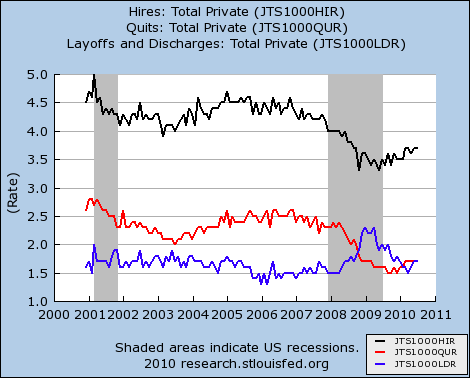
The figure above shows seasonally adjusted JOLTS data on the private sector for December 2000 through July 2010. This monthly survey, conducted by the Bureau of Labor Statistics, covers approximately 16,000 nonagricultural businesses. The black line shows that the estimated “hire rate” in the private sector was 3.7 percent in July. In other words, there were approximately 3.7 new hires in private industry for each 100 current employees in that part of the economy. This compares to 4.6 as recently as late 2006.

The other data series shown in the figure may shed more light on the validity of the leisure/job search explanation for high unemployment. The blue line shows the rate of “layoffs and discharges,” a category that includes all reported involuntary separations that were initiated by the employer. This figure peaked last spring at about 2.3 percent of the private-sector workforce and had fallen to a more typical level of 1.7 percent by July. The 2.3 percent figure, reached twice in early 2009, is the highest layoff and discharge rate for the period shown on the graph. Indeed, the graph shows a prolonged period beginning in late 2008 during which the rate of involuntary separations was well above the historical norm.

Finally, the “quit rate,” shown in red, is the percentage of workers who resign in the survey month, in this case July. For the private sector, this statistic fell from 2.3 percent at the start of the recession in 2007 to 1.7 percent in July. Hence, there has been only a modest increase in this rate since it bottomed out late last year at 1.5 percent. Recent low readings stand in stark contrast to an average observation of 2.4 percent for the period spanning December 2000 to November 2007. Such low quit rates strongly suggest that fewer rather than more workers than usual have been finding new jobs or resigning to take time off for job search, vacations, or home-based activities. The new statistics depict a job market in which many employees are losing their jobs or at least believe that it will be very difficult to find new jobs if they leave their current ones.
Comments


Less stimulating than it should be

Thomas Masterson | September 7, 2010

The Free Exchange blog calls President Obama’s proposed $50 billion infrastructure stimulus “A New Hope.” Our research begs to differ. We find that spending $50 billion on infrastructure would create little more than half a million new jobs. That’s not an inconsiderable number, but it’s a drop in the bucket compared to the 14.9 million who were unemployed in August (according to the last employment situation report).

There are strong arguments to made in favor of infrastructure spending. But if the administration were to spend the same amount on social care (child care, home health care, etc.), the employment gain would be more than twice as great, reaching nearly 1.2 million.Those would be lower paying jobs, but they would go to individuals further down the economic ladder–the people, in other words, most in need of help and most likely to provide further stimulus by promptly spending their earnings.

Perhaps the president’s latest proposal is merely a political trap Obama is setting for the Republicans, giving them yet another opportunity to ostentatiously oppose something popular. If so, good luck. But after the weaker-than-needed stimulus package last year, which is now running out of gas in terms of boosting employment, this proposal won’t provide much additional job growth. Half measures, as the saying goes, avail us naught. And this proposal is much less than half of what is needed.

Comments


Wray on Minsky

Daniel Akst | September 3, 2010

Levy Senior Scholar L. Randall Wray explains the foresight of Hyman Minsky in this video.

Comments


A way out for the Euro zone

Dimitri Papadimitriou | September 1, 2010

Suggestions a few months back by Germany’s chancellor that countries running consistently high deficits be expelled from the Euro zone evidently haven’t fallen on deaf ears. Even though almost everyone thinks of expulsion as a remote possibility, the notion does get factored into the thinking of bankers and investors in a way that may ultimately become a self-fulfilling prophesy. Fears of sovereign-debt debt default are not about to go away anytime soon.

But there is an alternative for dealing with public debt that may help achieve a more perfect union. The European Central Bank should create a large sum of money—say, a trillion Euros—and distribute it across the Euro zone on a per capita basis. Each country could use this emergency relief as it sees fit. Greece might purchase some of its outstanding public debt; others might spend it on fiscal stimulus.

If you think this idea will force every European household to purchase a wheelbarrow with which to transport its soon-to-be-worthless currency, consider the case of Japan. With a 227 percent sovereign debt to GDP ratio, Japan is the world’s most indebted nation. But close to half of this debt is held by the country’s central bank, and interest payments on this half are returned to the Japanese government, making it in effect interest-free. Basically, the central bank printed the money to acquire this debt. To inflation hawks, the creation of trillions of yen to finance government deficits raises the terrifying specter of runaway inflation. Yet prices in Japan over the last two decades have risen by a mere 6 percent—not annually, but for the entire period. The only problem with the yen, meanwhile, is that it’s too strong.

The ECB should do the same thing. It holds sovereign bonds, and it should refund the interest payments on this debt to the issuing countries just as the Japanese central bank has done. The Federal Reserve does the same thing when it returns all net earnings from its securities holdings to the U.S. Treasury.

Modern money economists would argue that over the longer term for the Euro zone countries it may be necessary to put in place a permanent fiscal arrangement through which the central authorities distribute funds to be used by member nations. Ideally this should be in the hands of the equivalent to a national treasury responsible to an elected body of representatives—in this case, the European Parliament. This would parallel the U.S. Treasury’s relationship with the American states. Perhaps an amount equal to 10 percent of Euro zone GDP would be distributed each year on a per capita basis to member nations. This would relieve pressure to adopt austerity and reduce the need to keep borrowing from financial markets. To be sure, the European Parliament has long engaged in transfers to its poorer nations—but its total budget has been below 1 percent of GDP, which is clearly too small to allow economies to operate near full employment even in the best of times. In a deep recession, even 10% of GDP might not be enough, in which case the EU can provide more funding.

A second option for over-indebted Euro zone states that has been put forward is to include a covenant in their debt instruments stating that in the event of default the bearer can use those securities to pay taxes. This would make it obvious to investors that these new securities are as good as cash, and would allow countries to finance deficits at low interest rates. This option may suffer from a “moral hazard” problem—it could lead governments to continue with business as usual, spending too much and generating inflation. And it does not resolve the fundamental problem with the euro—the absence of a supra-national fiscal authority that can generate an alternative to the “beggar thy neighbor” export-led growth strategy that the current arrangement promotes.

Comments


For the jobless, a feast of assumptions

Thomas Masterson | August 31, 2010

In a Wall Street Journal Op-Ed (why do I read these!?), Harvard economist Robert Barro claims that “according to [his] calculations” without extended unemployment benefits the unemploymnet rate would now be 6.8%. What are these calculations? Glad you asked!

To get a rough quantitative estimate of the implications for the unemployment rate, suppose that the expansion of unemployment-insurance coverage to 99 weeks had not occurred and—I assume—the share of long-term unemployment had equaled the peak value of 24.5% observed in July 1983. Then, if the number of unemployed 26 weeks or less in June 2010 had still equaled the observed value of 7.9 million, the total number of unemployed would have been 10.4 million rather than 14.6 million. If the labor force still equaled the observed value (153.7 million), the unemployment rate would have been 6.8% rather than 9.5%.

See? If you assume that long-term unemployment is caused by extended unemployment insurance benefits, then removing unemployment insurance extensions solves the problem of long-term unemployment (and you get a pony!). This must be why he makes the big bucks. Magical thinking.

Suppose we make a different assumption. Let’s assume that changes in consumer demand have an effect on the level of employment. If so, then the decision to not extend unemployment benefits would reduce demand for goods and services. Where will the jobs come from? Businesses are not going to expand their capacity or their workforce in the face of falling demand for their products. The only way that extending unemployment benefits could actually increase the unemployment rate above what it would otherwise be (other than just assuming it will, as Barro does) is to assume that the people receiving those benefits, rather than spending them on food and rent, use the checks to set fires to businesses that are currently employing people. This assumption has the advantage of actually leading to the conclusion that Barro reaches, without magic.

Comments


What’s new about QE?

Greg Hannsgen | August 30, 2010

After its last meeting, the Federal Open Market Committee, which makes decisions about Federal Reserve monetary policy, decided to keep its holdings of long-term securities constant. The Fed was forced to look again at this issue because borrowers have been paying off the long-term debt securities already in its portfolio. This maturing debt consists mostly of Treasury bonds, mortgage-backed securities, and Fannie Mae and Freddie Mac bonds, most of which were acquired quite recently. The Fed will reinvest the repayments in more long-term Treasury bonds instead of allowing its balance sheet to shrink.

Some have referred to the Fed’s acquisition of certain assets not normally seen on its balance sheet by the special term “quantitative easing,” or QE. This term is perhaps somewhat misleading, because it implies a sharp distinction between the recent policies to which it refers and the Fed’s more typical manipulations of the federal funds and discount rates. But, surprise, the new policy actions also involve interest rates, albeit ones that the Fed had not attempted to directly influence in many years when it began QE in 2008. Let’s hear what Ben Bernanke said at a conference last week:

….changes in the net supply of an asset available to investors affect its yield and those of broadly similar assets. Thus, our purchases of Treasury, agency debt, and agency MBS [mortgage-backed securities] likely both reduced the yields on those securities and also pushed investors into holding other assets with similar characteristics, such as credit risk and duration. For example, some investors who sold MBS to the Fed may have replaced them in their portfolios with longer-term, high-quality corporate bonds, depressing the yields on those assets as well.

In other words, the Fed is buying long-term securities mainly as a means of reducing the interest rates paid by the federal government and other borrowers when they issue long-term debt. These rates are crucial because many large purchases are paid for over a long period of time. These include homes and large-scale corporate investments such as new factories, which are usually expected to yield revenues over a stretch of many years. Of course, the Fed has not set an explicit target for any long-term interest rates. But it certainly did that during and immediately after World War II, which was the last time the federal debt was so large as a percentage of GDP. (Interestingly, during its history, the Fed has not always publicly committed itself to any interest-rate target at all.)

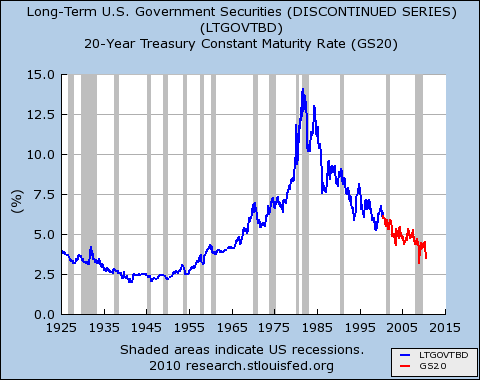
This graph, which shows interest rates on long-term securities issued by the federal government, offers some historical perspective on just how low interest rates are:


The figure depicts two data series maintained by the Federal Reserve, which I have had to splice together because neither series covers the entire time period shown in the graph, January 1925 to July 2010. It shows that throughout World War II and until 1953, the Fed kept long-term interest rates below 3 percent, which helped keep the cost of federal debt low. Of course, to do this, the Fed had to purchase many long-term government bonds. We wonder what will happen next.

(Graph updated with August 2010 data point and resized for readability September 15, 2010.)

Comments


How costly is child care?

Kijong Kim | August 26, 2010

You may already know that women’s workforce participation has increased and gender wage gaps have been closing gradually, although we still have a long way to go. Work-life balance can be costly, and raising children is rewarding yet financially challenging.

A new report by the congressional Joint Economic Committee gives an excellent description on the status of women and challenges they have faced in the labor market over the last 25 years (ht to Catherine Rampell at Economix).

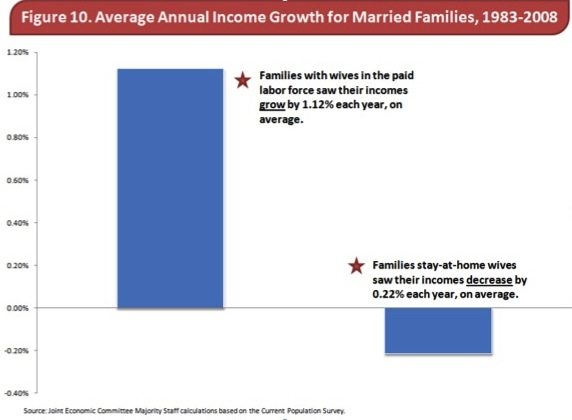
As a researcher of the care economy, I couldn’t help noticing the following two graphics. First, Figure 10 in the original report:

The opportunity cost of being a stay-at-home mom is high and grows as time goes by at the rate of 1.34 percent a year! Imagine how much worse off the family will be in 30 years with all the forgone income,  savings, and smaller social security checks to receive after retirement, and so on.

Some of you may claim that it was their deliberate choice to stay at home, so the society should not come to the rescue. Well, if Paris Hilton becomes mom and decide to stay at home to take care of her kids, she probable won’t need any social support other than occasional photo-shoot opportunities to upkeep her celebrity status. For most of us with less financial freedom than Ms. Hilton, however, the choice may have been in part forced by lack of affordable quality care.

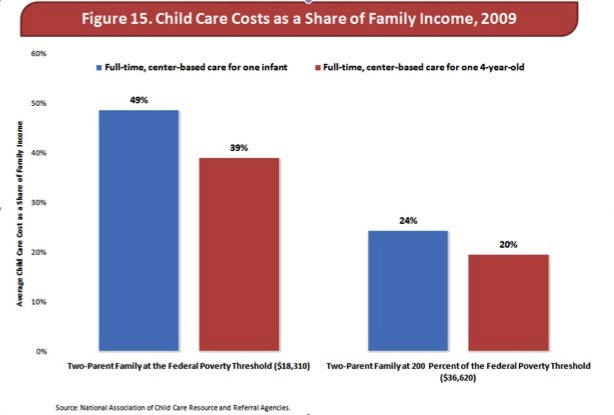
Speaking of costs, Figure 15 shows how unequal child care expenses are distributed across families with different income levels:

Looking at the costs as a share of family income, I wonder: how in the world can a mom can keep her job and send her kids to day-care, unless society provides support? Having kids appears to be one of the traps of poverty!

To address the inequalities of care burden, one solution is to expand social care provision and make it universal, if possible (universal care does not mean one is forced to join the system by law). It will not only free many, many women from the costly choice and burden, but offer jobs to many of them in the care economy, as my colleagues and I have proposed.

P.S. One question for readers:  what is a better way to internalize the positive externalities of raising the productive citizens of tomorrow, let alone ensuring the survival of human species? (I think funding NASA projects sort of fits in the question – cutting edge technology development and its spillovers, for instance the Temperpedic mattress, and the search for another habitable planet.)

Comments


Social Security remains affordable, even in long run

Greg Hannsgen | August 18, 2010

In Paul Krugman’s blog, a bit of good news from the August 2010 Social Security Trustees’ Report on the finances of the Social Security entitlement programs (retirement, survivors, and disability):

Given the apocalyptic rhetoric we’re hearing, once again, about Social Security finances, it comes as something of a shock—even to me—to look at the actual projections in the latest Trustees’ Report. OASDI [ed.: in plain English, Social Security spending] is projected to rise from 4.8 percent of GDP now to about 6 percent of GDP in 2030, and level off. That’s not trivial—but it’s not huge either.

Hence, the intermediate forecast reported by Krugman seems to indicate that we can maintain current benefit levels, retirement ages, and other rules for the foreseeable future using existing payroll and benefit taxes plus only a modest increase in federal revenues dedicated to Social Security programs. Perhaps more Americans will be able to retire fairly comfortably and at a reasonable age than some have predicted.

Coincidentally, not long after the report was released, a new exhibit marking the 75th anniversary of the signing of the Social Security Act opened here in the Hudson Valley, not far from the Levy Institute, at the Franklin D. Roosevelt Presidential Library and Museum. (The famous Roosevelt home is on the same site.) I hope to see the Social Security exhibit soon and may report back to you on what I find there.

Comments


A Levy scholar on the financial crisis

Daniel Akst | August 13, 2010

Over the course of the summer, Levy senior scholar James K. Galbraith gave a series of lectures in Europe laying out his view of the financial crisis that originated on this side of the Atlantic. At the most recent of these, in July, he emphasized the role of fraud:

It’s important to recognize that at the root of the financial crisis there was one of the greatest swindles of all economic history. The mortgages that were originated in the private sector in the United States which were then transformed into securities and sold through the financial markets around the world were in effect counterfeits. They were documents that looked like mortgages but were known by the people making them to be certain to fail.

Links to the rest of Galbraith’s talks are listed below:

continue reading…

Comments


High unemployment puts poor families at risk

Greg Hannsgen | August 6, 2010

Scholars at the Levy Institute have supported the creation of an employer-of-last-resort (ELR) program in the United States for many years. Such a program would provide a government job to any American who needed one and met a few basic requirements. (This readable policy note, along with many other Levy publications, explains the case for ELR programs.) So far, the government has created many jobs since the passage of the stimulus package, but the unemployment rate remains at 9.5 percent. Many forecasters are now predicting that the overall unemployment rates for 2010 and 2011 will both exceed 9 percent

Children are among the groups deeply affected by recessions. For example, a government report issued last November found that over one million children sometimes went hungry in 2008, which represented a large increase over the previous year.  Also, in a recent article, Katherine Newman and David Pedulla discuss how this recession has had an uneven impact, hitting groups like young people just entering the labor force especially hard.

Programs that helped the poor in times like these were weakened greatly in 1996, when President Bill Clinton somewhat reluctantly signed a welfare reform bill that was not what he had hoped for, saying that it was the country’s “last best chance” for reform. The Personal Responsibility and Work Opportunity Reconciliation Act set time limits for receiving welfare benefits, and converted the program from one that provided grants to all qualified families to one that came in the form of a grant of a fixed amount to each state. In passing the bill, leaders intended to expand work requirements for welfare benefits, but in practice many were not able to get work, appropriate training, and/or child care. The bill followed many years of reforms at the state and federal levels, some of which had enabled welfare recipients to obtain job training or to raise their incomes substantially by putting in more hours of work.

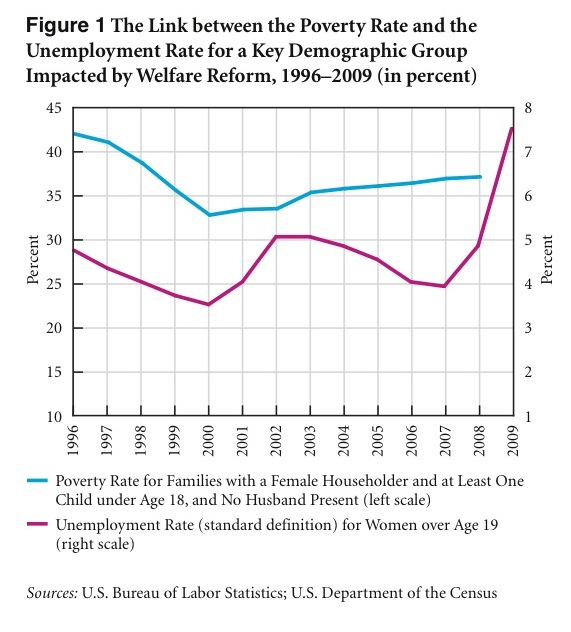
When the 1996 welfare reform effort took effect, many observers expected an eventual rise in homelessness and poverty, particularly among single-parent families. These effects seemed to have been avoided at first, and indeed poverty rates seemed to be falling as states implemented the new law. Many observers noted, however, that the job market was relatively tight during the late 1990s. The graph below (click on it for a larger view) shows two data series: unemployment for women over 19 years old and poverty rates for families with a female adult, children under age 18, and “no husband.”

The idea is to show how poverty for this group is related to the strength of the job market. Note that as welfare reform went into effect in the late 1990s, the unemployment rate for women was falling, mostly because of a booming economy. This trend helps to explain the fall in the poverty rate shown on the left side of the figure. Then, after the stock-market crash of 2000 and the recession that followed, the unemployment rate shown in the figure rose. It dropped a bit during the subsequent recovery, but then climbed again, reaching 4.9 percent in 2008. This reduction in demand for workers partially explains the steady rise in poverty that occurred during the same period, to more than 37 percent in 2008. Fortunately, improvements in the earned income tax credit (EITC) program probably helped to contain increases in poverty rates during this period. Of course many other factors affect poverty rates, some related to the business cycle and some not.

Unfortunately, as the graph shows, the unemployment rate for women more than 19 years of age rose again in 2009, by 2.6 percentage points—a big increase. The Census Bureau has not released poverty rates for that year, but this analysis shows that there is very good reason to believe that the new data will show that the rise in most poverty rates continued in 2009. Moreover, monthly data for this year show that the unemployment rate for women over 19 continued to rise in 2010 and stood at 7.9 percent as of June. Last month’s employment data will be released later this week. This information suggests that job creation efforts and other initiatives to help the unemployed and underemployed should be on the increase and not on the wane.

Comments