Do we need federal debt at all?

(Click figure to enlarge.)
Could the government loan the money to itself? The federal government is expected reach its debt limit of $14.29 trillion early next month. Normally, the government more or less indirectly sells a large amount of Treasury securities to the Fed, which is technically a private entity, separate from the familiar government run by the President, Congress, and the Supreme Court. This amount has been increasing rapidly, as shown by the red line in the figure above. As the figure suggests, quantitative easing II, or QEII, which officially ended last month, represents only the most recent version of this sort of open-market policy initiative, though it was highly unusual in that it involved very large purchases of Treasury bonds. Hence, even when the government finds that it has to borrow money to pay for its expenditures, it need not borrow from domestic or foreign private investors, or even foreign central banks or the International Monetary Fund (IMF). Instead, it can essentially turn to itself, borrowing from what is close to a government agency, charged with acting in the public interest. Nonetheless, unfortunately, official Treasury Department bond auctions will presumably cease if and when the federal borrowing limit is reached, rendering Fed purchases largely irrelevant to the resolution of Washington’s debt-limit predicament.
Hence, the question arises: if the federal government doesn’t always borrow from the public when it sells bonds, but instead often relies on the Fed, why not dispense with Treasury bond sales altogether and have the Fed simply loan or even transfer funds directly to the federal government whenever tax revenues fall short of expenditures? It would obviously not be simple or easy to switch to such a monetary system, but at least until fairly recent times, most developed countries outside the English-speaking world found it best to provide liquidity for government activities in this way, avoiding the use of open-market operations and making their central banks more literally into instruments of the national governments involved. In such banking-oriented systems, private companies, too, tend to rely heavily on banks rather than financial markets when they need to obtain funds to build new plants, etc. Interest rates are mostly set directly by the banking system rather than in markets. Such financial systems have both advantages and disadvantages, relative to systems like the American one that rely far more heavily on securities and derivatives markets. In many ways, though, the two types of central bank are fundamentally the same, particularly in the way they are relied upon to help pay for government operations.
The issue remains, though, is there anything to be gained by having specific numerical limits on government debt such as the ones imposed by the U.S. Congress? The answer is “no.” Keeping the current limit would only result in a self-imposed disaster.
Update, July 21: Fellow Levy Institute scholar Randy Wray expresses some of the opinions and ideas set forth above in a great blog post that coincidentally appeared on the same day as the one above. G.H.
Update, July 26: James Surowiecki argues to good effect that debt ceilings should be eliminated in a new article in the New Yorker. -G.H.


 ShareThis
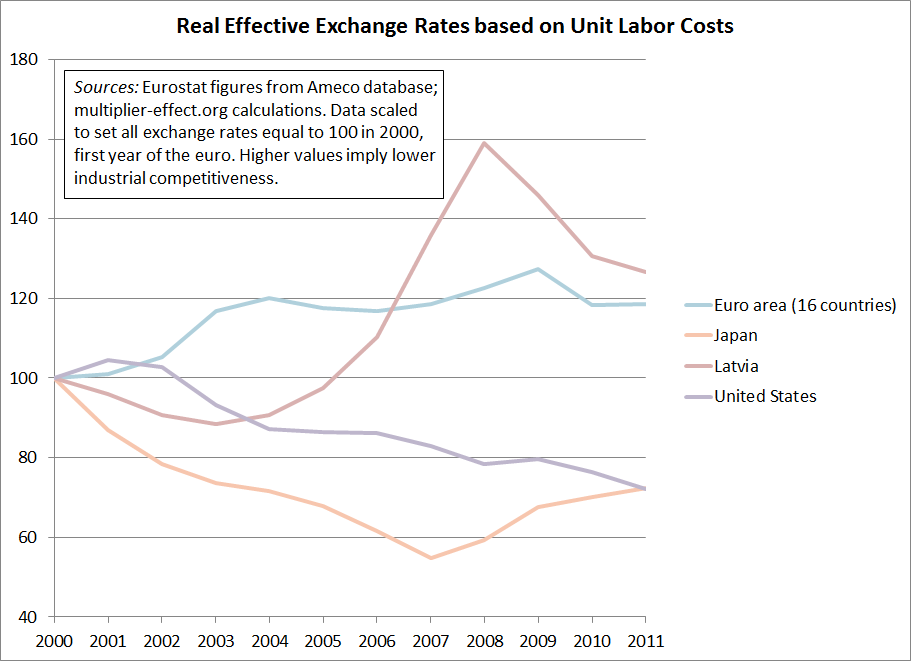