Arestis on the EU’s New Fiscal Compact

Michael Stephens | December 20, 2011

Philip Arestis and Malcolm Sawyer have a guest post at Triple Crisis that critiques the latest proposal for a new fiscal compact in the EU (essentially an SGP with more automatic sanctions for those who surpass the 3 percent of GDP budget deficit limit and the annual structural deficit limit of 0.5 percent of GDP).  Arestis and Malcom note the asymmetrical restrictions of the compact (there are limits on deficits, but not surpluses) and demonstrate that the deficit limits are entirely too stringent:

The ‘fiscal compact’ assumes that an upper limit of 3 per cent of GDP is consistent with a near balanced structural budget despite the swings in economic activity and associated swings in budget deficits as the automatic stabilisers take effect. As a rule of thumb a 1 per cent fall in GDP below trend leads to around a 0.7 per cent rise in the budget deficit – hence a more than 3 per cent drop in GDP before trend with a structural deficit of 0.5 per cent would lead to a country breaching the limit. Note that this is a drop in GDP below trend – and could come from an actual drop of more like 1 per cent (with a 2 per cent trend growth rate).

Comments


New MBA in Sustainability

Michael Stephens |

BARD COLLEGE TO LAUNCH INNOVATIVE MBA IN SUSTAINABILITY

Now Enrolling Students for Fall 2012 in New York City

www.bard.edu/mb

ANNANDALE-ON-HUDSON, N.Y. — Responding to a revolution in business strategy and to rising student demand, Bard College announces the creation of a new Master of Business Administration in Sustainability Program. Based in New York City, the new MBA in Sustainability responds to the dramatic surge in demand for training in sustainable business practices being created by green start-up businesses and major corporate efforts, such IBM’s Smarter Planet and General Electric’s Eco-Imagination. The two-year program, which will start in fall 2012, is being developed as a partnership between the Bard Center for Environmental Policy (Bard CEP), which grants M.S. degrees in environmental policy and in climate science and policy, and the Levy Economics Institute of Bard College, a leading nonpartisan economic policy research organization.

“Bard is proud to make a substantive contribution to such an important field,” said Bard College President Leon Botstein.

The Bard MBA in Sustainability provides a rigorous education in core business principles, as well as sustainable business practices, with a focus throughout on economics, environment, and social equity. Green companies must achieve quality production and performance, efficient operations, sound financial management, deep employee engagement, responsible and effective marketing, creative responses to changing economic conditions, flexible strategies, and continuous innovation. In courses on leadership, operations, marketing, finance, economics, and strategy, students will be constantly challenged to integrate three goals: profit, continuous reduction in ecological impact, and stakeholder engagement.

The Bard MBA is structured around five weekend intensives every term (four in New York City and one in the Hudson Valley), with additional instruction between intensives. The program’s innovative residency structure—with classes held over long weekends once a month—will enable students and professionals from across the East Coast to attend and will allow regional and national leaders in business sustainability to engage students in the classroom. The New York City campus will become a laboratory for first-year students, who will participate in yearlong consultancies with New York–area businesses, government agencies, and nonprofits. Bard MBA faculty and guest lecturers will include leading scholars in business, economics, and environmental policy from Bard’s full-time faculty as well as cutting-edge practitioners in business sustainability, corporate and nonprofit leaders, journalists, and consultants.

“The Bard MBA is one of only a handful of programs around the world that builds sustainability into the curriculum from the ground up,” said Bard CEP Director Eban Goodstein, who will direct the new program. Goodstein, who has been working with General Motors to refine its own sustainability strategy—seeking competitive advantage by developing low-emissions transportation options—recently took the stage at the company’s headquarters in Detroit to speak to 1,000 GM employees about a sustainable clean-energy future. “It’s not something we would have imagined as recently as four years ago. Sustainability is mainstream, and increasingly a key factor in corporate strategy,” Goodstein said. “It’s time for business education to catch up.”

For more information about Bard College’s MBA in Sustainability, please visit www.bard.edu/mba

Comments


More on the Bailout of the Banking System

Michael Stephens | December 19, 2011

J. Andrew Felkerson writes at AlterNet about the study he authored detailing the Federal Reserve’s bailout of financial institutions over the course of the latest crisis.  He explains some of the reasoning behind his study’s methodology, particularly with respect to his use of a cumulative measure of loans and asset purchases (the other two measures he uses involve the peak amount outstanding at a moment in time and peak weekly amounts):

Perhaps the largest difference in our analysis is that we learned our money and banking theory from the late Hyman Minsky. He taught us that the modern economy is essentially financial, and as such, is prone to systemic financial crises that if left unchecked can lead to “bone crunching depressions.” Therefore it is essential to have a LOLR. Thus, any transaction between the Fed and the markets which is not part of conventional monetary operations, such as lending from the discount window or open market operations, represents an instance in which private markets were not able to or were unwilling to engage in the normal financial intermediation process. If it any point in time the private markets were capable (or willing) to carry out business as usual, Fed intervention would not have been required. Thus, we need to account for each extraordinary event, and the best way that we know to do this is by summing each instance–which results in a cumulative total of over $29 trillion dollars.

Read the rest here.

Comments


29 Trillion Dollars, One Page

Michael Stephens | December 16, 2011

Randall Wray has a new one-pager following up on the release of a report detailing and tallying up the Federal Reserve’s extraordinary efforts to prop up the banking system—a report with the rather eye-catching headline number of $29.6 trillion.  The Levy Institute working paper, the first in a series, is part of a Ford Foundation-supported project undertaken by James Felkerson and Nicola Matthews under Wray’s direction.

In the one-pager, Wray explains the methodology and justification behind the report’s presentation of the raw data that was released (after some persuasion) by the Fed.  As an example, he runs through the numbers for just one facility, the Primary Dealer Credit Facility (PDCF) created in March 2008, and explains the three different measures compiled by the report.  First, they present the peak outstanding commitment (loans and asset purchases) at a point in time ($150 billion); then the peak flow of commitments over a week ($700 billion); and finally, the cumulative total over the life of the facility ($9 trillion).  Again, this is all for one facility (PDCF).

What’s the point of all these numbers?  Wray explains:

Take your pick: the appropriate number chosen depends on the question asked. The smallest number answers the question, What was the Fed’s peak exposure to losses (assuming the Fed would let the institutions fail without extending even more credit to them)? The middle number indicates how much it took to meet liquidity demands during the worst week of the crisis, from the point of view of the dealers. And the biggest number tells us how much the Fed had to intervene over the life of the facility in order to settle markets.

Read Wray’s one-pager here.

Reading through the report, one can’t help but be struck by the contrast between the Fed’s fierce and, let’s say, imaginative approach to the banking crisis and the institution’s comparatively tame, chin-stroking acceptance of the needless waste of human potential represented by near-9 percent unemployment.

Comments


Why don’t people quit their jobs more during a recession? asks tenured University of Chicago economist

Thomas Masterson | December 15, 2011

It’s difficult to know where to begin with this post from Casey Mulligan (the comments are definitely worth reading). He starts off by implying that those who might want to characterize the recession as involving “a lack of hiring” are simply misled by the nature of aggregate data on hiring and separations. He goes on to say this is due to the fact that turnover rates (and therefore hiring and separations) for younger people are higher throughout the business cycle than for older workers. He links to this 2010 Brookings paper by Michael Elsby, Bart Hobijn and Aysegul Sahin. Unfortunately for Mulligan’s point, the authors have this to say:

Measures of unemployment flows for different labor force groups yield an important message on the sources of the disparate trends in unemployment across those groups: higher levels and greater cyclical sensitivity of joblessness among young, low-skilled, and minority workers, both in this and in previous downturns, are driven predominantly by differences in rates of entry into unemployment between these groups and others. In sharp contrast, a striking feature of unemployment exit rates is a remarkable uniformity in their cyclical behavior across labor force groups—the declines in outflow rates during this and prior recessions are truly an aggregate phenomenon.[p.3]

While Mulligan states, correctly, that “[e]stimated job separations among employees ages 25-54 were 33 percent greater in 2009 than they were in 2007,” he stumbles into trouble by asserting that “the low employment rates for young people since 2007 are almost entirely explained by low hiring rates.” While the latter statement is true, it is also true, and conspicuously absent from Mulligan’s piece, that hiring rates fell as much for older workers as for younger workers. Figure 8 of the Elsby, Hobijn and Sahin paper clearly shows this dynamic: hiring has dropped precipitously for all age groups since 2007, while separations increased by much more for older workers and remains higher than the 2007 level.

Given the plunge in hiring detailed in the paper Mulligan refers to, what is one to make of this argument:

Before the recession began, quits were by far the most common type of separation; now the number of quits about equals the number of layoffs.

Perhaps the decline in quits is a signal of what’s ailing the economy, although I view it largely as a consequence of the unemployment insurance system. A person who quits his or her job is not eligible for unemployment insurance. As a result, calling a job separation a “quit” rather than a “layoff” results in the loss of unemployment benefits.

For some strange reason, Mulligan chooses to focus on separations, rather than unemployment inflows, and then blames unemployment insurance for this trend (Casey-watchers will have seen this coming a mile away). Of course, separations includes people who leave one job to go to another job. Separation trends from quits and layoffs are reported in Figure 11 in the Elsby, Hobijn and Sahin paper (see below), which I guess is where Mulligan got that trend. Interestingly, that same figure also shows inflows into unemployment from layoffs and quits, which paint a somewhat different picture than the one Mulligan wants us to see: continue reading…

Comments


Bernanke’s 29 Trillion Dollar Fib Exposed

L. Randall Wray | December 13, 2011

(cross posted at New Economic Perspectives)

As I reported here and over at Great Leap Forward, a new study by two UMKC PhD students, Nicola Matthews and James Felkerson, provides the most comprehensive examination yet of the Fed’s bailout of Wall Street. They found that the true total cumulative amount lent and spent on asset purchases was $29 trillion. That is $29,000,000,000,000. Lots of zeros. The number is quite a bit bigger than previous estimates. You can read the first of what will be a series of reports on their study here. I want to be clear that this is a cumulative total—and for reasons I will discuss in this post it is the best measure if we want to understand the monumental Fed effort to restore Wall Street to its pre-crisis 2007 glory.

It is certain that no government anywhere, ever, has committed so much to benefit so few. Wall Street owes the Fed a big fat wet kiss. That’s a kiss Chairman Bernanke apparently does not want.

Last week he extended the Fed’s veil of secrecy over its bail-out of Wall Street by trying to counter a recent Bloomberg analysis of the extent of the Fed’s largess with a fog of deceit. Apparently the Chairman forgot the lesson we learned from Watergate: the cover-up is always worse than the original indiscretion.

Bloomberg had found that the Fed committed $7.77 trillion to the biggest banks. Bernanke provided a memo that claimed the real total was only $1.2 trillion. The memo went on to argue that much of the Fed’s lending benefited small banks, recipients of student loans, and even manufacturing firms like Harley Davidson. Finally, it claimed that throughout the bail-out, the Fed’s actions were transparent, with Congress continually updated on the Fed’s actions.

It was quite a performance, reminiscent of the kind of misleading statements the previous Chairman, Alan Greenspan, made before the House under interrogation by the late, great, Representative Henry B. Gonzalez. Gonzalez—trying to shine a bit of light into the Fed’s secret meetings—asked whether the Fed kept tapes of its FOMC meetings (shades of Watergate). Greenspan fibbed, answering “no.” Realizing that it is not a good idea to lie to Congress, he went back to the office, convened a conference phone call of Fed officials and warned them that they likely all would be called before Gonzalez’s committee. He said it would be up to them to decide to tell the truth, or to continue the charade.

You see, the Fed did tape every meeting and had been doing so since the days of Watergate; but the tapes were transcribed and then (supposedly) erased and used for subsequent recordings. In the end, the Fed decided to tell Congress the truth, and agreed to release edited transcripts within 5 years. So on some generous interpretation, Greenspan’s fib was not a lie. You can now read the transcripts on-line. (See the FOMC transcripts for the period from October 1993 to May 1994 for discussions surrounding the wisdom of operating with greater openness—and for fascinating internal discussions about how to deal with González and Congress; see also my article.)

However—and this is a real scandal—the Fed is routinely shredding the original transcripts (only the edited versions are available). You see, the Fed claims that because it is “independent”, it is not subject to normal “sunshine laws” that require maintaining government records. And its meetings that discuss monetary policy and bank supervision are also exempt from sunshine, according to the Fed.

But that is a topic for another day even though it should be infuriating to Congress.

Let us get back to Bernanke’s 29 trillion dollar fib. continue reading…
Comments


Credit Default Swaps: Banking on Failure

Michael Stephens |

Micah Hauptman of Public Citizen has drawn from the work of the Levy Institute’s Marshall Auerback and Randall Wray to put together a concise piece that lays out five core critiques of credit default swaps.  Among the basic problems he highlights is a flaw-riddled process for determining when a CDS pays off:

… there are no bright lines to determine when a CDS payment is triggered. The system for determining when payments should occur is murky, unregulated, and replete with conflicts of interest. For speculators to cash in on their bets and receive CDS payments, there must be a “credit event.” Failure to pay when due is the most common credit event, however a “credit event” can also occur through bankruptcy, a change in interest rate, a change in principal amount, or postponement of interest or principal payment date. But even within these occurrences, there is considerable legal debate over what constitutes an “event.”

Consider the current financial crisis in Greece. The country has experienced distress due to mounting government debt. European officials recently reached a tentative restructuring agreement. Under the agreement, Greece will undergo a strict austerity plan to regain solvency and Greece’s creditors will receive a reduction in their interests. Whether this restructuring agreement constitutes a “credit event” will likely be contested.

Decisions like this as to whether a “credit event” has occurred are made by the International Swaps and Derivatives Association (ISDA) Determinations Committee—but as Hauptman points out, the ISDA committee includes representatives of financial institutions (some of the largest banks and hedge funds) that often have a stake in whether payments are triggered.

Read Hauptman’s piece here.

For those who are paying attention to the meltdown in Europe, credit default swaps are likely to make a dramatic reappearance.  Bloomberg reports, for instance, that European banks are selling CDS on their own member-nation’s debt (via Zero Hedge).  Banking on failure indeed.

Comments


Projections of EU GDP

Gennaro Zezza | December 12, 2011

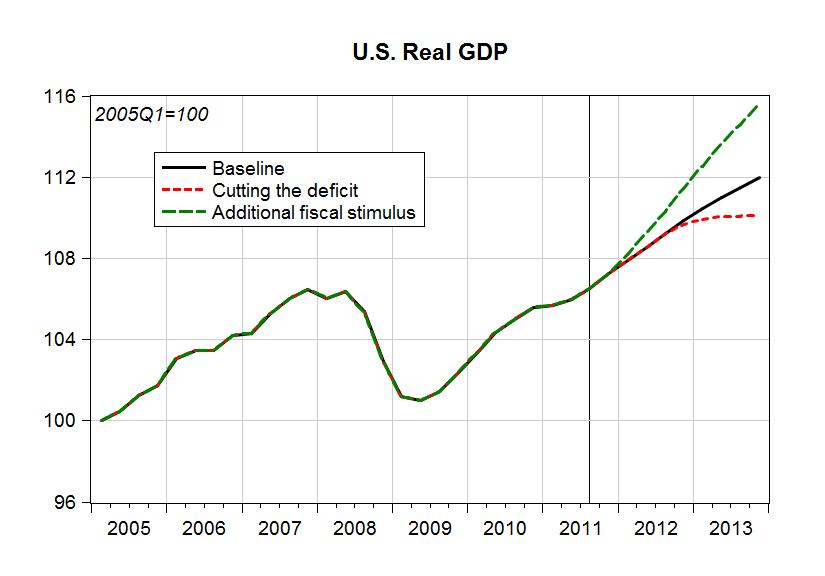
In our latest Strategic Analysis we estimate that a cut in the general government deficit in the United States would have strong adverse effects on unemployment and a relatively smaller impact on the U.S. public debt-to-GDP ratio, since GDP would slow down with a cut in government expenditures and transfers.

A similar strategy of deficit reduction seems to be on the agenda for many eurozone countries; notably Italy, where a new government was recently put in charge to implement unpopular tax increases that the Berlusconi government was not willing to adopt.

A comparison of our simulation for the U.S. with the European Commission’s for the eurozone may therefore be interesting.

First of all, the United States is now (third quarter of 2011) back to the pre-recession level of output, as measured by real GDP. Using this figure we could say that the recession is behind us, and we can plan for the future (although this is far from true if we look at the unemployment rate!). And in our projections we show that an acceleration in aggregate demand is needed if the unemployment rate is going to be reduced (the green line), while policies to cut the government deficit will lead to stagnation (the red line) and an increase in unemployment.

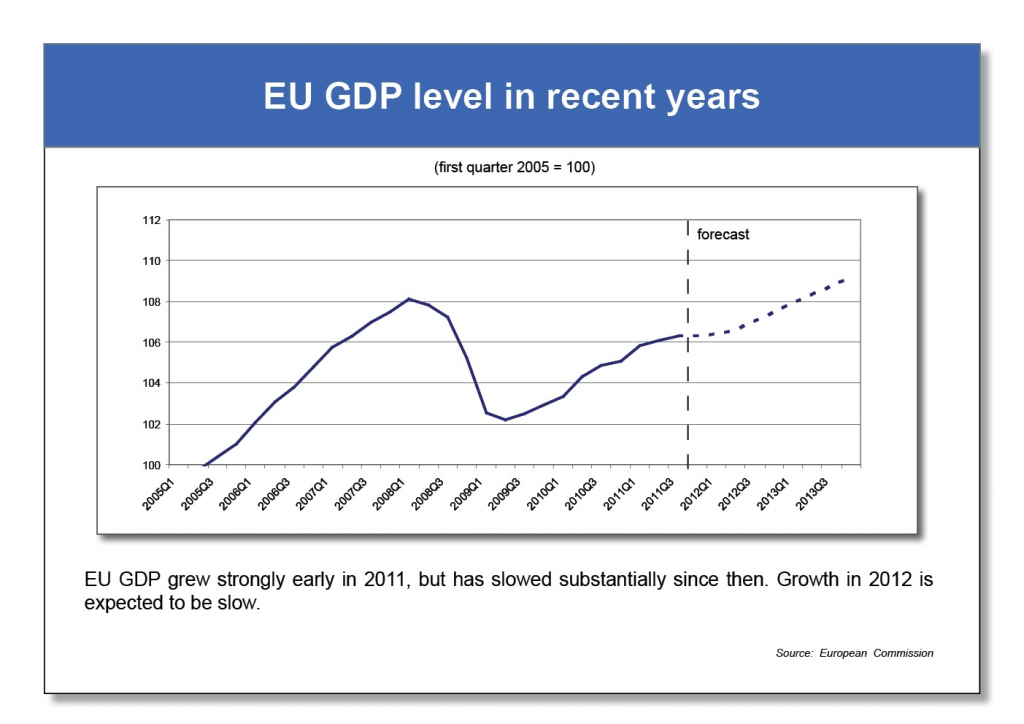
Let’s look at a similar chart for Europe, taken from a simple synthesis of the new roles for economic governance in the area:

Real GDP in the area is still below its pre-recession level, and stagnating. We would think that European governments would be meeting frequently to discuss how to recover the lost ground in output and employment, but instead they meet with quite a different problem in mind: how to enforce balanced budget rules on national governments. The Italian government, still one of the largest economies in the area, is now passing a bill that will increase taxes substantially, further depressing domestic demand.

What the EU is planning is the wrong policy at the wrong time. And if the multiplier in the EU is similar to what we estimate for the United States, the consequences for the unemployment rate will be substantial.

Comments


$29 Trillion Bailout: Response to Critics

L. Randall Wray | December 10, 2011

OK, anytime one criticizes the Fed or Wall Street there will be some push-back by the professionals who serve their masters. (By contrast, Barry Ritholtz understood the argument, see here.)  My original piece on Friday got picked up by a number of blogs and generated a lot of hostile responses. I expect that. It is obvious from their comments that many of them did not bother to read the post very carefully, or, if they did, that they stuck to talking points. And it looks like many of them deal in obfuscations that would make Chairman Bernanke proud.

But let us presume they were not hired by the Fed and Goldman and instead assume good intentions. I will have a longish post over at New Economic Perspectives tomorrow that addresses several issues that were not adequately covered in my post on Friday. But here I will deal with the main topic of a number of the comments—which centered around the proper way to measure the Fed’s intervention: stocks or flows.

Several commentators presume I cannot tell the difference between stocks and flows. No long-time reader of this blog or of NEP would be confused about this. I know the difference, and indeed have been using Wynne Godley’s stock-flow consistent approach for a very long time.

As I said on Friday, we can choose any of three different measures to ascertain the size of the Fed’s response. First, we can look at peak lending at an instant; more practically, we could choose end-of-day lending by the Fed. We can measure this by looking at the Fed’s balance sheet, adding across the assets associated with the emergency lending facilities (a Fed loan to a bank shows up on the Fed’s balance sheet as an asset; a Fed purchase of an asset from a bank moves that asset to the Fed’s balance sheet.) This is the measure the Fed chooses, and it comes to a peak of $1.2 trillion on a day in December 2008.

(It will miss any off-balance sheet commitments. For example, if the Fed extends a guarantee that does not get triggered, it will never show up on the Fed’s balance sheet, meaning that a measure that includes only assets on the Fed’s balance sheet will miss some of the ex ante exposure to risk. We’ll ignore that here. Much like Bernanke’s claim that the lending turned out OK—because most loans got paid back—that is 20-20 hindsight and does not count when it comes to ex ante risk.)

OK, the peak instantaneous lending is a useful measure. I have never denied that. The analogy is to the six shot glasses poured by the bartender. If we want to tally up the Fed’s exposure to losses, that is a relevant measure. But note that my piece was not focused on risk to the Fed. To be sure, $1.2 trillion is a big exposure. It merits some concern. To my mind, this is a second order issue, although it is highly probable that Congress will be very concerned with Fed exposure to losses. continue reading…

Comments


The Shadow Banking System Is Slowly Imploding

Thorvald Grung Moe | December 9, 2011

Lessons from the bankruptcy of MF Global — the 8th largest in US history

Yesterday, CEO Jon Corzine of MF Global appeared before the House Agricultural Committee. The hearing was a reminder that despite well intended legislation, including the Dodd-Frank Act, the speculative behaviors that brought down AIG and Lehman are still considered fair business deals in the financial sector.

Recent reports on the financial crisis in Europe confirm that MF Global was not an isolated case. The extent of speculative positions among banks have reached mind-boggling proportions, with OTC derivatives now standing at over $700 trillion (!) and increasing rapidly.  Banks in Europe are currently scrambling for funds as their regular sources of funds are rapidly drying up. Several analysts point to the fragility of the shadow banking system as a key determinant of the ongoing liquidity crisis, where virtually unlimited leverage seems to be the norm rather than the exception.

According to a Reuter’s report yesterday, the bankruptcy of MF Global shows how the London OTC market has been used by AIG, Lehman, and now MF Global to accumulate layers and layers of leverage on only a tiny bit of capital. The process of re-hypothecation is behind all of this, with especially lax rules in London permitting, for example, the finance arm of AIG—AIG Financial Products—to run up a CDS position of $2.7 trillion just before the firm collapsed in 2008.

Re-hypothecation occurs when a bank or broker re-uses collateral posted by clients, such as hedge funds, to back the broker’s own trades and borrowings. The practice of re-hypothecation runs into the trillions of dollars and is perfectly legal. It is justified by brokers on the basis that it is a capital efficient way of financing their operations, much to the chagrin of hedge funds. 

Over the years regulators gradually relaxed the quality requirements for such re-hypothecation, from initially only treasuries, to eventually money market funds, and now foreign sovereigns. This was the legal basis for the legitimate trades MF Global was engaged in, buying AAA European sovereign paper, despite their hedge fund clients probably shorting the whole sector. Eventually MF Global lost trust in the market and couldn’t meet the liquidity run when clients wanted their money back all at the same time (“classic bank run”). This then led to a scramble for cash, in the process also compromising client accounts. But, as several commentators have pointed out, the basis for their implosion was speculative trades on the basis of this process of re-hypothecation, leading up to a leverage ratio of close to forty. continue reading…

Comments