About a year ago, supply-side economist Arthur Laffer (known for the “Laffer curve,” a graph that depicted tax revenue first rising, then falling as tax rates increased) published an op-ed piece in the Wall Street Journal predicting sharply higher inflation and nominal interest rates over the next four to five years. The justification given for this claim was the rapid growth of the money supply, as measured by the Fed’s monetary base statistic, since the fall of 2008.
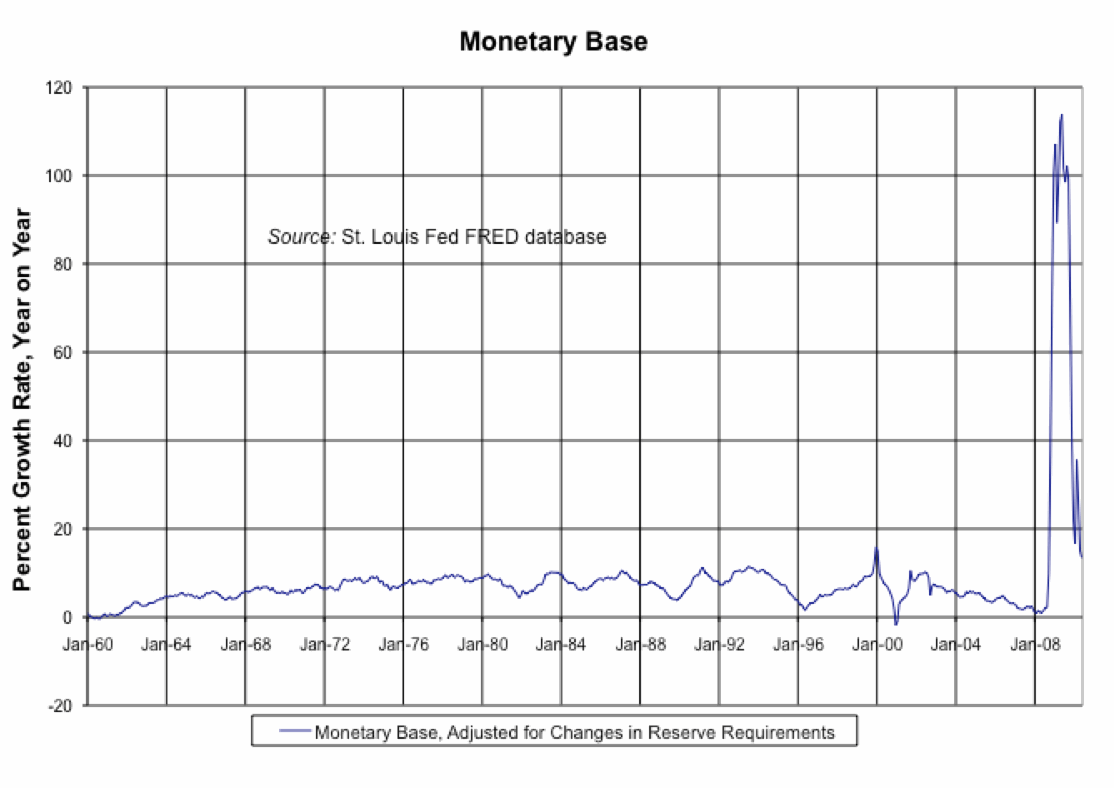
 One year later, inflation has not taken off. Meanwhile, the stock of currency and bank reserve deposits at the Fed has continued to grow rapidly, though growth has slowed markedly over the past year. The chart to the left (click on it for a better look) shows that Laffer’s preferred measure of money-supply growth has trended downward recently. It remained at about 100 percent, year-on-year, in the three months immediately following the op-ed piece. Since then, money-supply growth has remained in the double-digit range. However, there has been no discernible and sustained upward trend in nominal interest rates or inflation. Many recent events have conspired to keep these numbers at low levels. On the other hand, an argument can be made that the money supply itself is mostly a somewhat unreliable indicator of what is happening, rather than a crucial mover of the economy.
About 40 years ago, economists Nicholas Kaldor and James Tobin, both followers of Keynes, published important articles arguing that changes in the “money supply” in themselves were probably not causes of economic growth or inflation, but instead a product of those forces. (This claim does not mean that interest rates do not play an important role.) Monetarists like Milton Friedman, who had long argued that the growth rate of the money supply determined the growth rate of nominal income in the short run and inflation in the long-run, had it almost completely backwards, according to this post-Keynesian view. Granted, the Fed chooses in a literal sense the size of its balance sheet by making voluntary asset trades, loans, etc., but as a practical matter it cannot consistently maintain an arbitrarily chosen money-supply growth rate. For example, the Fed usually targets the federal funds rate. This forces it to buy or sell just enough bonds to stay at the targeted interest rate, which affects the supply of Fed liabilities in often-unpredictable ways. Attempts by central banks around the world to set and meet targets for the growth rate of the money supply have been repeatedly frustrated and, worse, have often led to recessions.
The Fed has recently expanded the range of assets it buys and sells in order to guide the economy, in what might seem more like a deliberate policy decision. (Mortgage-backed securities, longer-dated bonds, and some distressed assets obtained from failing firms and institutions are important examples of the types of assets currently held by the Fed in significant amounts.) One might assume that such purchases are well within the Fed’s power to control. But there is less discretion even in these actions than many observers seem to think. For example, in the Fed’s view and that of the federal government, a decision to ignore the AIG situation could have led to a wider financial panic, because it would have threatened investment banks and other companies with which AIG had done business. As Hyman Minsky pointed out repeatedly in his writings, working to alleviate and prevent financial crises by helping failing banks may be the most crucial of the Fed’s duties—more important even than setting interest rates. The recent crisis seems unusual only because it was by some measures the most serious challenge of its type in many years. Despite the unusual scope and size of the bailout efforts, the Fed’s overall approach set very few precedents, and wide-ranging efforts to stabilize financial institutions and markets could not possibly have been avoided without serious economic consequences, though perhaps the task could have been accomplished at a much lower cost.
Such efforts have ineluctably led to the huge money-supply growth rates that are shown in the figure. Laffer pointed out that most of this growth was due to a dramatic increase in bank reserves. However, high levels of reserves will not lead to significantly increased lending unless financial institutions believe that more loans will be repaid with a profitable return, an eventuality that in the current situation will await stronger demand for American goods and services. Anyway, because of the weakness and fragility of the recovery, many fewer economists worry about excessive lending now than one year ago.
Actions that the Fed is in effect compelled to take—either to meet an interest-rate target or to fulfill its lender-of-last resort function and similar obligations to stabilize the financial system—cannot be seen as fundamental causes of inflation. Doubtless, a failure to perform either of these key central-bank functions effectively could lead to a deeper recession and/or deflation. But even to the extent that the Fed is responsible for adverse economic outcomes, these are likely to be the result of mistakes in interest-rate policy and in stabilizing the financial system, which are best not thought of as erroneous decisions about the proper growth rate of the money supply.


 ShareThis