Archive for the ‘Monetary Policy’ Category

Do we need federal debt at all?

Greg Hannsgen | July 20, 2011


(Click figure to enlarge.)

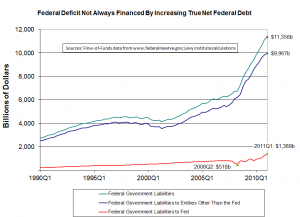
Could the government loan the money to itself? The federal government is expected reach its debt limit of $14.29 trillion early next month. Normally, the government more or less indirectly sells a large amount of Treasury securities to the Fed, which is technically a private entity, separate from the familiar government run by the President, Congress, and the Supreme Court. This amount has been increasing rapidly, as shown by the red line in the figure above. As the figure suggests, quantitative easing II, or QEII, which officially ended last month, represents only the most recent version of this sort of open-market policy initiative, though it was highly unusual in that it involved very large purchases of Treasury bonds. Hence, even when the government finds that it has to borrow money to pay for its expenditures, it need not borrow from domestic or foreign private investors, or even foreign central banks or the International Monetary Fund (IMF). Instead, it can essentially turn to itself, borrowing from what is close to a government agency, charged with acting in the public interest. Nonetheless, unfortunately, official Treasury Department bond auctions will presumably cease if and when the federal borrowing limit is reached, rendering Fed purchases largely irrelevant to the resolution of Washington’s debt-limit predicament.

Hence, the question arises: if the federal government doesn’t always borrow from the public when it sells bonds, but instead often relies on the Fed, why not dispense with Treasury bond sales altogether and have the Fed simply loan or even transfer funds directly to the federal government whenever tax revenues fall short of expenditures? It would obviously not be simple or easy to switch to such a monetary system, but at least until fairly recent times, most developed countries outside the English-speaking world found it best to provide liquidity for government activities in this way, avoiding the use of open-market operations and making their central banks more literally into instruments of the national governments involved. In such banking-oriented systems, private companies, too, tend to rely heavily on banks rather than financial markets when they need to obtain funds to build new plants, etc. Interest rates are mostly set directly by the banking system rather than in markets. Such financial systems have both advantages and disadvantages, relative to systems like the American one that rely far more heavily on securities and derivatives markets. In many ways, though, the two types of central bank are fundamentally the same, particularly in the way they are relied upon to help pay for government operations.

The issue remains, though, is there anything to be gained by having specific numerical limits on government debt such as the ones imposed by the U.S. Congress? The answer is “no.” Keeping the current limit would only result in a self-imposed disaster.

Update, July 21: Fellow Levy Institute scholar Randy Wray expresses some of the opinions and ideas set forth above in a great blog post that coincidentally appeared on the same day as the one above.  G.H.

Update, July 26: James Surowiecki argues to good effect that debt ceilings should be eliminated in a new article in the New Yorker. -G.H.
Comments


Should the Dollar Remain Independent of Gold?

Greg Hannsgen | July 1, 2011

(Click figure to enlarge it.)

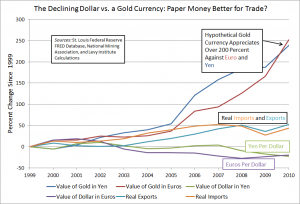
Some “gold bugs” advocate a return to the gold standard, which the United States officially abandoned in the early 1970s.  The annual data in the chart above show that the price of gold has risen sharply in both euros and yen since 1999. Meanwhile, the dollar itself has fallen against both of the currencies, as shown by the lines near the bottom of the chart. Easy monetary policy has played a role in this drop. But a weakening currency has been one factor behind the recent increase in U.S. exports. The latter grew more than imports in percentage terms over the period shown in the figure. But nonetheless, both imports and exports grew by over 40 percent. It would have been difficult to increase exports at all with U.S. goods and services priced in a surging gold-backed currency.

It goes without saying that the price of gold could possibly fall rather than rise in coming years. But dealing with a commodity money whose value can abruptly change in ways that harm the economy is always a severe drawback of a currency backed by gold. Of course, if the United States had adopted a gold-backed currency in 1999, U.S. wages, prices, etc. would likely have behaved much differently than they did. Hence, one cannot be sure what the outcome of a switch to the gold standard would have been.  But these other changes could also easily have been detrimental to the health of the U.S. and world economies.

Comments follow:
continue reading…

Comments


20th Annual Hyman P. Minsky Conference about to begin!

levyadmin | April 13, 2011

Many Levy Institute scholars and staff members are in New York City for this year’s conference on the late Institute scholar and author. Breakfast should be ending now, with the conference about to begin. The conference’s theme is “financial reform and the real economy.” More information about the conference, including the program, are available at the conference page on the Institute’s website.

Update, approximately 3 pm, April 13: The first audio from the conference has now been posted to this page on the Institute website. Now available there is audio from the conference’s formal opening and from the first session. You can choose among recordings of Leonardo Burlamaqui, Dimitri B. Papadimitriou, Jan Kregel, L. Randall Wray, and Eric Tymoigne. The conference ends this Friday, April 15.

Comments


Krugman, Galbraith, and others debate MMT

Greg Hannsgen | March 28, 2011

Paul Krugman slugs it out with our colleague Jamie Galbraith and many other “modern monetary theory” partisans at Krugman’s New York Times blog website. Jamie’s most recent retort is at the top of this page of the blog site. Many of the points raised in the discussion there are central to our work here at the Levy Institute and to the views of Galbraith and others in our macro research group.

Update: More links to the ongoing Krugman-MMT debate can be found here.  -G.H., March 31.

Update, August 11: Krugman on MMT again, this time drawing lessons from French fiscal policy between World Wars I and II.

Comments


How Tight Have ECB Policies Been in Real Terms?

Greg Hannsgen | March 24, 2011


(Click picture to enlarge.)

Readers may have seen two charts that are part of a column by David Wessel published last week. For five European countries, they compare actual interest rates with those prescribed by a standard policy rule. Wessel’s charts provide some interesting evidence that European Central Bank monetary policy has been either too loose or too tight most of the time for several currently ailing European economies, given these countries’ inflation rates and gaps between actual and potential output.  Wessel’s charts support the article’s theme, which is that severe economic problems in some Eurozone countries result in part from the “one-size-fits-all” interest rate policies of the ECB.

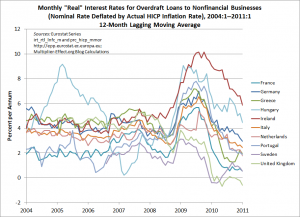
Along the same lines, at the top of this entry is a chart of short-term “real interest rates” faced by business borrowers who use overdraft loans in a group of European countries, which are mostly members of the euro area. I have used data on interest rates for this common type of loan, adjusting each month’s observation to reflect the same month’s measured consumer price inflation, so that the resulting “real rates” take into account inflation’s effects on the burden of loan payments. Inflation is helpful to debtors because it has the effect of reducing the amount of goods and services represented by each dollar owed under the terms of a loan. Of course, I have used only one of many possible methods that one could employ to approximate real interest rates.  Moreover, to construct a true real interest rate data series, one would need to know borrowers’ forecasts of the inflation rate, which is an impossible requirement in most circumstances. Hence, these series and others like them usually need to be taken with a grain of salt.

As theory would have it, real interest rates in different countries tend over the long run to converge on a common value, a result known as “real interest rate parity.” This convergence is assured only under certain exacting conditions that are clearly not met in the case of the numbers depicted in the chart. Nonetheless, the degree to which the rates differ may provide another indication of the disparities in credit costs that are imposed by a unified central banking system. Moreover, the chart shows that some of the countries now experiencing fiscal crises have been suffering the effects of particularly tight credit conditions. For example, Greece’s real interest rate was 20.49 percent in January, as indicated next to the green line representing the Greek data. Real rates for Ireland and Portugal, two other countries whose governments’ financial problems have recently been in the news, are also shown in the figure.

My next chart shows lines for all of the aforementioned countries, plus 7 others, containing points that are constructed by averaging the last 12 months’ observations from the first chart.  This removes most of the effects of regular seasonal patterns and helps to highlight longer-run trends, which would otherwise be obscured by the extreme volatility of these series. As a result, we are able to include data for 10 European nations in this figure.

(Click picture to enlarge.)

The data underlying the figures are harmonized European statistics, which are meant to be somewhat comparable across national boundaries. Nevertheless, the ten series in the figure seem to show no signs of converging, though their movements appear to be highly correlated over the past three years. According to the averaged data, Irish real interest rates have been the highest among the 10 European economies represented in the graph since approximately spring 2009. In January, the unaveraged real rate in Ireland exceeded 9 percent.

Like Wessel’s diagrams, the ones above show that despite centralized interest-rate setting, one measure of the tightness of policy for actual retail borrowers varies greatly across eurozone economies.

Notes:

continue reading…

Comments


Data Show Increased Fed Role in Financing Federal Debt

Greg Hannsgen | March 15, 2011

(Click on graph to enlarge.)

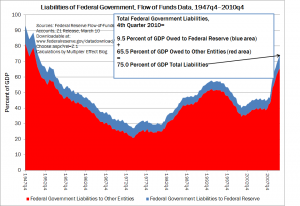
Some interesting information on the federal government’s balance sheet can be gleaned from the fourth-quarter flow-of-funds report, which was released by the Federal Reserve Board on the 10th of this month. The total amount of all federal liabilities, as reported by the Fed last week, is shown as the sum of the red and blue areas in the figure above. The blue portion of the graph represents net liabilities owed by the federal government to the Federal Reserve System, while the red portion shows the rest of the federal government’s liabilities. The blue portion is best netted out of the total debt when one is calculating a figure to be used for policy purposes, as it essentially represents a sum of money that one part of the federal government owes to another. (The Fed describes itself in its educational literature as “independent within the government,” though it is shown in flow-of-funds reports as a separate entity with a separate balance sheet from that of the federal government.)

As noted in the figure above, total federal liabilities, according to the new data, rose in the fourth quarter of 2010 to 75.0 percent of seasonally adjusted U.S. GDP from 72.6 percent the previous quarter. Of this 2.4 percentage-point increase, 1.6 percentage points were accounted for by an increase in net Fed holdings of federal government liabilities, while all other entities increased their combined holdings of these liabilities by only about nine-tenths of a percentage point. Hence, ignoring the more-of-less irrelevant holdings of the Fed, the federal debt stood at approximately 65.5 percent of GDP as of the end of last quarter.

When the Fed purchases federal government liabilities using its open market account, it is swapping money for debt securities, so that economic sectors other than the Fed and the federal government wind up holding more U.S. currency and/or reserve deposits and fewer interest-bearing U.S. liabilities than before. This helps the Fed keep interest rates lower than they otherwise would have been as the total debt rises. Dimitri Papadimitriou and I discuss the increased use of this “financing” strategy in a recent working paper.

A couple of minor technical points: These figures are approximate and do add up in some cases because of rounding. Also, the Fed liabilities data are not seasonally adjusted, though, as noted above, I have divided them by seasonally adjusted GDP figures from the FRED database at the St. Louis Fed website.

Revised to improve clarity by G. Hannsgen on March 17, 2011 at approximately 8:20 am. Specifically, I have clarified the point that the blue portion of the figure, representing federal government liabilities to the Fed, is a net amount. In other words, it shows the amount of federal liabilities to the Federal Reserve System minus the amount of liabilities that the Fed owes to the federal government, all divided by GDP and expressed in percentage terms. Some discussion of this point might have been helpful. To wit: most of the federal government’s liabilities to the Fed are Treasury securities; an example of the opposite variety would be one or another of the several “bank accounts” that the government holds at its central bank. To determine how much the federal government owes the Fed, one must subtract the balance in these bank accounts and the like from the government’s gross liabilities to the Fed. It is only such net amounts that are shown in the blue portion of the figure above. Those figures are in turn subtracted from total federal liabilities as reported in quarterly flow-of-funds data to yield approximations of the quarterly “true” federal debt, which are, of course, depicted by the red area in the picture.

Comments


A New Peek at the Secrets of the Fed?

Greg Hannsgen | February 2, 2011

In December, the Levy Institute issued a working paper that asked how the economy might be affected by the seemingly unusual fiscal and monetary policies implemented by the Fed and other central banks since 2008. The authors, Dimitri Papadimitriou and I, used a phrase that is not often spoken in this era by governments and central banks around the world: “monetizing the deficit.” This phrase traditionally describes the practice of financing a government deficit with money that is “printed” rather than borrowed or raised by taxation. We feel perhaps a little more comfortable with our use of these words in light of a recent blog entry on the Financial Times website Alphaville. The blog reports that the Fed has come close to running out of securities to buy in the markets for certain types of government bonds, having bought so many of them already. Hence, it is increasingly resorting to the purchase of recently issued bonds and notes, which it had apparently sought to avoid. This development makes the link between deficit spending and monetary policy initiatives such as the current round of “quantitative easing” in a monetary system like ours easier to grasp. If the Fed buys a Treasury security almost immediately after it is issued, there is less reason than ever to think of the financing process as anything other than the use of the Federal Reserve’s “printing press” to pay for government operations–an essential use of “monetization” to stimulate the economy and avoid drastic fiscal measures during a time of weak tax revenues. Some worry still, but this practice has been used many times by numerous governments around the world and seems unusual only in light of common but unrealistic beliefs about monetary systems and how they normally work. Hence, those in Congress should not give credence to arguments that it is necessary to eliminate entire government programs or freeze major parts of the federal budget in order to restore some fanciful state of budgetary normalcy.

February 10 addendum on recent news: A short and interesting article on the implementation of quantitative easing policies was posted very recently on the New York Fed’s website. The article mentions changes in the composition of the Fed’s asset purchases, including the recent increase in purchases of newer issues that was reported in the Alphaville blog entry linked to above.  On the other hand, the new piece, based on a speech by a Fed official, finds no evidence that the Fed’s purchases have caused “significant market strains.” The article covers some other important issues associated with the recent policy actions involving long-maturity securities and might be interesting to people wanting detailed information about these topics.

Comments


Long-Term Interest Rates Brought Up to Date

Greg Hannsgen | January 21, 2011

U.S. Long-Term Government Bond Interest Rates, 1925-2010

Last summer, this blogger posted a graph showing the path followed by U.S. long-term interest rates since 1925.  There has been some interest in a new and updated graph, especially in light of concerns that bond markets might soon demand higher yields as the economy expanded. One appears above. Reasons for apprehension about a possible jump in yields vary and include large federal deficits, which increase the amount of bonds that must be absorbed by the market, as well as concerns about a possible resurgence of inflation driven by quantitative easing (QE) and a near-zero Federal Funds rate.  The Financial Times [homepage link] and some other newspapers have been reporting recently on a perhaps greater threat to price stability worldwide: a continuing run-up in the prices of some key agricultural commodities, brought about mostly by factors other than macroeconomic policy.  There has been some discussion of rising yields for long-term government bonds, but the long-term perspective offered by the figure above shows that interest rates remain very low by historical standards, at least for now.

Moreover, real yields on federal inflation-indexed securities remain quite low indeed, and in some cases negative, as shown, for example, by the green line in the figure below. Broadly speaking, such yields are what markets expect certain inflation-protected bonds to yield in addition to compensation for inflation.  Hence, they can be viewed as indicators of the costs of borrowing after expected inflation is taken into account. These costs have apparently been trending downward since 2008. (Some related but different interest rate series remain in positive territory, including for example one type of ten-year inflation-indexed bond issued early last year, which is yielding a little over .8 percent. By the way, the red line in the graph below shows only the most recent data points from the figure at the top of this post. This  longer-term nominal rate is not comparable to the inflation-indexed series depicted by the other line.)  These data show that recent Fed efforts to ease the terms on which money can be borrowed in a time of large deficits have continued to prove efficacious in a way that many economists find puzzling, though it is unlikely that these monetary policy actions alone will have a large impact on the rate of economic growth.

Nominal Interest Rate (shown in red) and "Real Rate" (shown in green)

Comments


American-German divide on macroeconomic policy alive and kicking

feifan | November 29, 2010

by Jörg Bibow, Skidmore College

Developments surrounding the recent G-20 summit further underlined some starkly conflicting views among key global policymakers, an important “American-German divide” in matters of macroeconomic policy in particular. For instance, referring to the Federal Reserve’s latest quantitative easing (“QE2”) initiative, Germany’s finance minister Wolfgang Schäuble briskly attacked U.S. policy as “clueless” and “irresponsible”. In his view, it is inconsistent for the U.S. to accuse the Chinese of exchange rate manipulation while steering the “dollar exchange rate artificially lower with the help of their printing press”. While highlighting that the final remnants of global policy consensus at the G20 level have evaporated, Mr Schäuble is clearly missing the real inconsistencies in international policymaking today.

Take Mr Schäuble’s assertion that Germany’s export success was not based on any exchange rate tricks, but on increased competitiveness. This would seem to imply that the euro’s decline from $1.50 to $1.20 in the context of Europe’s so-called “sovereign debt crisis” was neither a competitive depreciation nor any other kind of exchange rate trick, but a legitimate booster of German competitiveness; conveniently super-charging Germany’s export engine though. Rather less convenient, at least from the viewpoint of the rest of the world, is the fact that austerity across Europe will do little to boost German and European imports – when Europe happens to be the U.S.’s most important export market.

continue reading…

Comments


Does paying interest on reserves stall growth?

Thomas Masterson | November 18, 2010

In an interesting (pun intended) post (Economist’s View: Interest on Reserves and Inflation) Mark Thoma says that the Fed’s paying banks interest on their reserves does not dampen investment, for two reasons, one on the supply side and one on the demand side. On the supply side of the market for loans, Thoma points out that 0.25% (the rate the Fed is paying on reserves) isn’t that high. On the demand side, Thoma says that businesses have a lot of cash on hand that they’re not using to invest, meaning the demand for loans isn’t really there. I want to take issue with the second point, because while large corporations may indeed have a lot of cash on hand, small businesses and households don’t. And they are the ones who are being denied access to credit.

continue reading…

Comments